Insight for an Uncertain World
About Us
Robust Analytics develops solutions to improve aviation safety, air traffic management, and airline operations. We specialize in integrating high-volume aviation streaming data with real-time analytics to monitor and predict changes in operating conditions at U.S. airports. Risk Tracker delivers up-to-the-minute measurement of hazards, risk precursors, and risk events in terminal areas at 26 airports in the NAS. The SafeFlight safety margin forecasting system integrates diverse hazard and risk data into a comprehensive assessment of airspace safety margins and flight risk status. The tool predicts airspace safety margin state four hours ahead, in 15-minute intervals. Hazards that affect an aircraft during the final 60 minutes before landing are monitored continuously. SafeFlight integrates the airspace safety margin forecast with a crew fatigue model to generate a comprehensive flight risk profile.
What Drives Safety Margins?
An Aviation Safety Monitor Special Report
If we had been asked in early January 2025 what combination of conditions would most likely be implicated in a midair collision in terminal airspace, we would have offered the following list:
- Traffic is above the 50th percentile
- High workload for controllers and pilots
- Nighttime
- Winter month
- Arriving aircraft are conducting curved approaches
- Instrument meteorological conditions (IMC) are present
- High winds and/or wind gusts
The first five of these factors were present at Reagan National Airport during the January 29, 2025 collision between American 5342 and a U.S. Army UH-60 Black Hawk. More generally, we can estimate how much these factors affect safety margins with the data generated by the Risk Tracker safety monitor during the past couple of years.
What do we know? Safety margins decrease when meteorological conditions are below VMC and when more air- craft are in the airspace. These factors are significant and operate at all airports and time periods. Safety margins degrade during nighttime with the strongest effect at higher traffic densities. How large is the nighttime impact? At Atlanta Hartsfield International Airport during high traffic periods, buffer encroachment durations roughly double under the same traffic and weather conditions during nighttime.
First, a refresher on how we measure safety margins. The Aviation Safety Monitor measures safety margins by esti- mating the frequency, duration, and severity of buffer encroachments. A buffer encroachment occurs when an air- craft pair is predicted to be closer than the minimum separation standard – both lateral and vertical – for that air- space. The encroachment algorithms account for aircraft type (heavy and other aircraft), airspace rules, horizontal distance between successive aircraft, and vertical separation. The FAA has defined minimum separation standards when aircraft are under Instrument Flight Rules (IFR). In this research, the buffer encroachment algorithms use the separation standards as a baseline to define the adequate safety margin levels.
The buffer encroachment algorithms do not identify loss of separation events. Instead, they evaluate what would occur if aircraft continued on their current speed and heading. Avoidance of a loss of separation when a buffer en- croachment occurs requires action by flight crews and controllers. In many cases, these actions call for the aircraft to follow well-defined procedures accurately and in a timely fashion. In that sense, when the algorithm identifies a buffer encroachment it highlights a situation in which pilots and controllers must operate with a shared awareness of what all aircraft in the airspace will be doing. It is with this understanding that we interpret buffer encroachments as a measure of safety margins in the airspace.
To learn more about we measure safety margins, read our article https://www.robust-analytics.com/measure that provides much more detail.
There is strong seasonal variation in safety margins when measured by buffer encroachments. Safety margins are greatest in the summer months, then gradually degrade into winter before improving in the spring. Figure 1 shows the daily time series of buffer encroachment durations for the 26 airports in 17 metroplexes tracked by the Aviation Safety Monitor. The encroachment thresholds are adjusted to account for meteorological conditions.
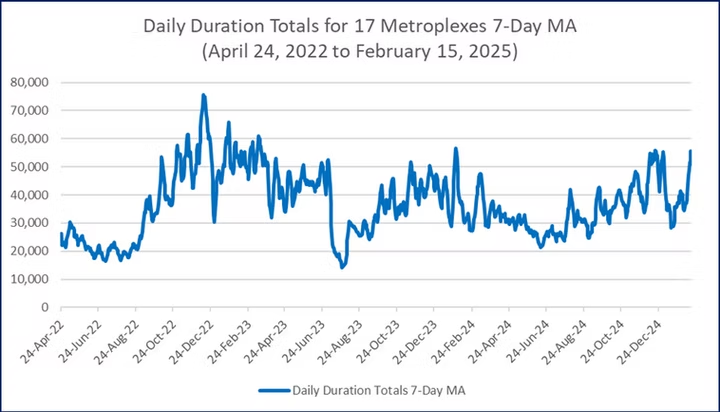
Figure 1. Changes in Daily Encroachment Duration Totals for 17 Metroplexes from April 2022 2022 Through February 15, 2025 (7-Day Moving Average)
Safety margins decrease when meteorological conditions are below VMC and when more aircraft are in the air- space. These factors are significant and operating at all airports and time periods.
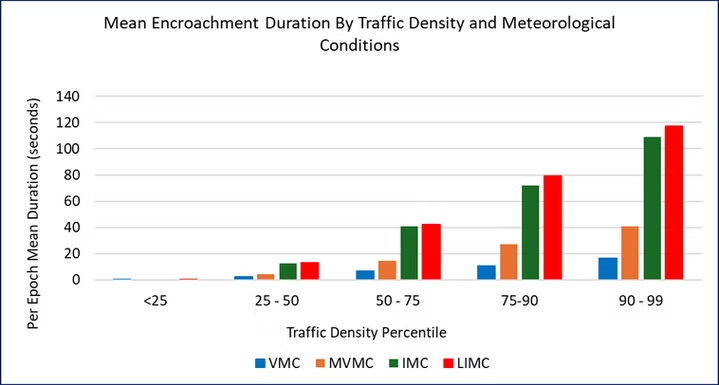
Figure 2. Mean Encroachment Duration Totals by Meteorological Conditions
and Traffic Density – All Airports
Safety margins are lower during nighttime hours but only at higher traffic densities as shown in Figure 3. Encroach- ment durations per aircraft increase dramatically once traffic density approaches the 75th percentile. This impact is likely the primary driver of increased encroachment durations during winter months.
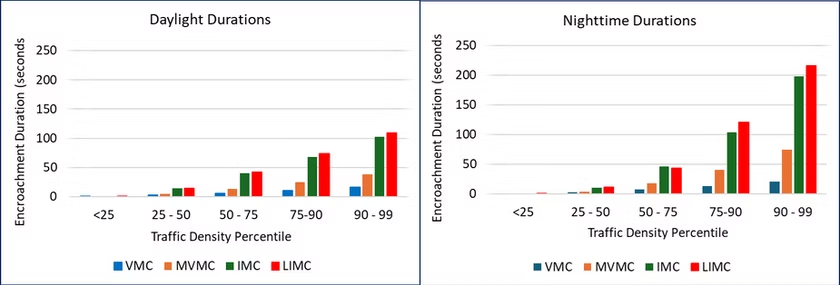
Figure 3. Buffer Encroachments Increase During Nighttime Hours at Higher Traffic Levels
Perhaps the most informative way to illustrate the significance of these safety margin factors is to show how the buffer encroachment durations vary under different conditions at a specific airport. Figure 4 shows this information for ATL under different traffic densities, different meteorological conditions, and daylight versus dark hours. Meteoro- logical conditions are VMC, MVMC, and IMC. There were not enough observations to predict durations under LIMC and higher traffic density conditions.
The percentiles are calculated for each airport and serves as a normalization of traffic and capacity. Traffic density percentile categories for ATL are:

The differences across the combinations of risk factors are large and statistically significant as shown in Figure 4. The mean for the top value in the chart, IMC with Density 4 and nightime, is more than 12 times greater than when it is VMC during daytime with traffic density between the 25-50th percentile. The Robust Analytics research team first observed the impacts of traffic density and meteorological conditions several years ago, but the finding of the strong effect of darkness on buffer encroachments is new and startling. We have long puzzled over the strong seasonal pattern in buffer encroachments in which they increase during the late autumn and winter months, then decline with low values in the summer. We now know at least part of the answer to that puzzle is that encroachments increase sharply during dark hours, but generally only at higher traffic counts.
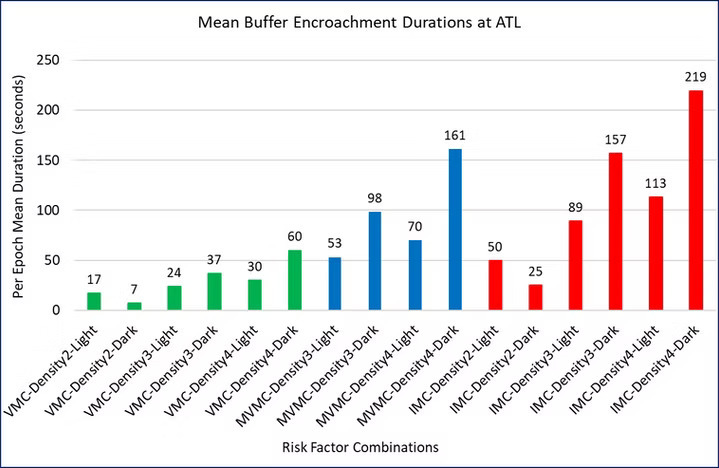
Figure 4. Effects of Traffic Density, Meteorological Conditions, and Nighttime at ATL
Another way to highlight the importance of meteorological conditions and darkness is to compare encroachment durations at the same time of day at a single airport. Figure 5 reports predicted buffer encroachment duration at ATL at 6:00 PM local time under different meteorological conditions. The early evening rush hour at ATL places it in the Density 4 category at the 75-90th percentile of traffic count. Changing the meteorological conditions from VMC to MVMC increases the mean encroachment duration from 30 to 70 seconds. When weather conditions degrade to IMC the mean duration increases another 43 seconds.
In Atlanta during the summer, 6:00 PM local is bright daylight but the airport turns dark by that hour in December. This seasonal change increases the mean encroachment duration by 30 seconds during VMC and by 91 seconds during MVMC. The increase is even greater during IMC, as the mean encroachment duration jumps by 106 seconds. Summarized differently, when ATL moves from daylight to dark under otherwise identical conditions, the mean encroachment duration roughly doubles. The data suggest strongly that nighttime safety margins are not nearly as large as during daylight, even when ceiling and visibility are good.
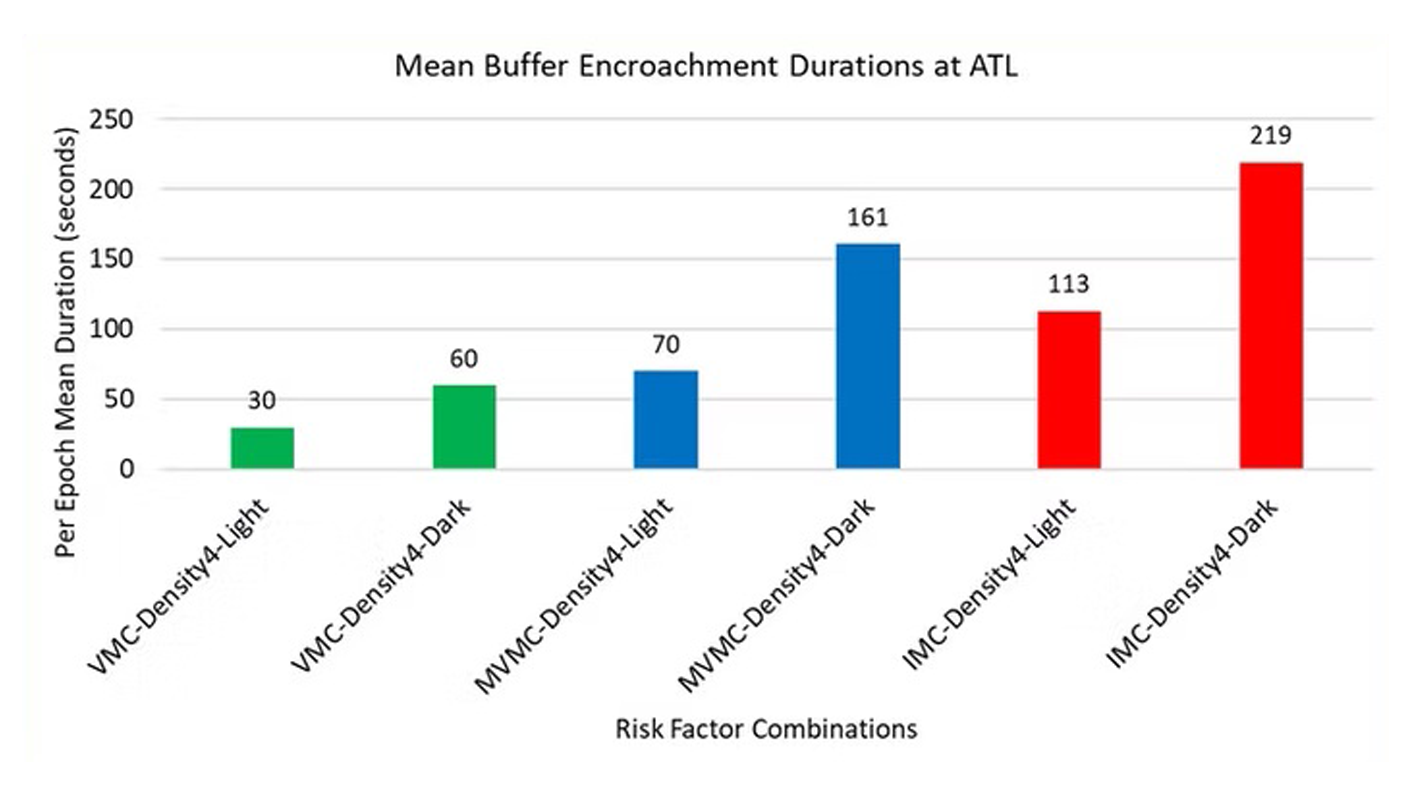
These charts highlight the most significant factors affecting safety margins that we have estimated. Regression analyses also showed that winds higher than 10 knots and high wind gusts can add a few seconds onto the predicted encroachment durations.
About the Aviation Safety Monitor
The Aviation Safety Monitor is a service provided by Robust Analytics to deliver timely information on terminal area safety in the National Airspace System (NAS). The safety monitoring and prediction technologies were developed by Robust Analytics over the past several years. Partial funding was provided by the NASA Small Business Innovation Research Program and the NASA System Wide Safety Project.
The Aviation Safety Monitor provides quantitative estimates of safety margins at 26 airports in 17 metropolitan regions in the United States. This information complements data on several safety-related events that are published elsewhere, with the FAA’s Runway Incursion Statistics website a good example. However, the available safety information can be misleading if it only reports the frequency of violations with no insight into how safety buffers may vary minute-to-minute and day-to-day. The Aviation Safety Monitor aims to provide this insight every week.
The Aviation Safety Monitor summarizes output from Risk Tracker, the Robust Analytics in-time terminal airspace hazard and safety metrics monitoring system.


Safe Flight
SafeFlight integrates data on multiple flight risks to predict the risk status of a terminal area several hours ahead.

ASMET
The Airspace Safety Margin Evaluation Tool (ASMET) integrates data on flight plans, aircraft position reports, weather, infrastructure status, and traffic density to identify and predict terminal area airspace risk state.

ORCA
ORCA will provide airlines with the ability to better predict operational conditions at destination airports, allowing them to build better flight plans and manage their network operations to improve on-time performance, customer satisfaction, and assist the FAA in matching demand at choke points to available capacity

Aviation Data
Need aviation data? We have it. Flights, weather, delay information and more!
