Aviation Safety Monitor Weekly Report for the Week Ending August 23, 2025
Safety margins declined last week, continuing the modest and erratic negative trend of the past five weeks. Category A and B encroachment durations rose 11.3 percent last week and are now up 25 percent over the past five weeks. Category PE and C durations are also trending up, rising 22 percent last week and 88 percent over the last five weeks. Much of the rise in durations comes from an increasing encroachment duration per event that rose 20 percent over the past month. The 7-day moving average of hourly encroachment durations increased 34 percent over the last five weeks. It is now clear that the big improvement in safety margins the NAS experienced in late June and July has stopped and reversed. This pattern is consistent with previous transitions from late summer into autumn.
Weekly Safety Margin Update. Every Monday Robust Analytics reports on safety margins at 26 United States airports. With this Aviation Safety Monitor Weekly Report, Robust Analytics offers the aviation community timely assessments of changing safety margins and safety-related events. Dates and times are tracked in UTC and the week ends at midnight every Saturday. This week’s report includes data through 2400 UTC on August 23, 2025.
For New Readers: Please read our article “Did Safety Degrade in the National Airspace System in the Winter of 2022-2023?” that applies our methods and data to examine whether safety margins decreased during the events of winter 2022-2023. https://www.linkedin.com/pulse/did-safety-degrade-national-airspace-system-winter-kpq8e/?trackingId=dLIUDpIMzA34g3H4GDwrHw%3D%3D
The Aviation Safety Monitor measures safety margins by estimating the frequency, duration, and severity of buffer encroachments. Our paper “How Do We Measure Safety Margins?” provides a detailed description of the methods and data. That article can be found here https://www.robust-analytics.com/measure on the Robust Analytics website.
The Weekly Safety Report uses buffer encroachment events and durations to measure changes in safety margins. Safety margins decreased slightly last week, continuing the modest but uneven trend of the past month. Total encroachment durations rose 13.3 percent while the number of encroachment events only increased 2.1 percent, increasing the duration per event by more than two seconds.
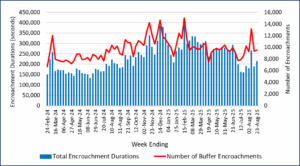
Figure 1. Weekly Buffer Encroachment Metrics at 26 Airports
The Aviation Safety Monitor calculates buffer encroachments in four separation conformance categories based on the severity of separation deviation. Category PE and C buffer encroachments identify relatively weak separation conformance deviations and are strongly affected by meteorological conditions. In fact, by definition, during visual meteorological conditions there are no buffer encroachments. The more severe encroachments in Category A and B provide a better indicator of changing safety margins.
In previous years, Category A and B buffer encroachments would peak in the winter months and they gradually decline. For most of 2025, however, the decline was modest and Category A and B mean daily encroachment durations for April 1 through June 30 were 42 percent higher than the same period one year ago. July was a good month for safety margins, however, as the daily mean encroachment duration fell 34 percent, getting the metric down to a value more typical for midsummer. Through two thirds of the month of August the encroachment duration metrics have risen, with daily encroachment durations up by 27 percent.
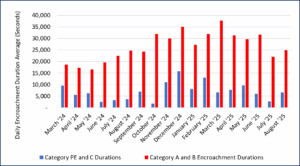
Figure 2. Mean Daily Buffer Encroachment Durations By Month
Figure 3 reports the weekly total durations for the two conformance category groupings. The Category PE and C weekly durations bounce around with little long-term trend since we started reporting in February 2024, primarily reflecting week-to-week variations in meteorological conditions and some seasonal variation. Last week the PE and C buffer encroachment durations jumped 88 percent, while category A and B duration totals rose 25 percent, for a net increase of 34 percent.
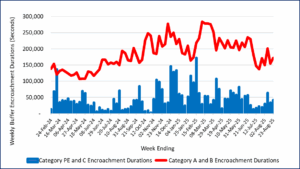
Figure 3. Weekly Trends in Encroachment Durations By Separation Conformance Category
Figure 4 reports the 7-day moving average of hourly buffer encroachment durations in all conformance categories since February 2024. The pattern is very clear, as the historical behavior of increasing buffer encroachments from the summer low into winter held, but metrics did not improve for the first six months of 2025. Buffer encroachment durations rose in September and October, then bumped up again in November and have remained high most the time until late June.
It was not until July that we observe a sustained, significant decrease in the buffer encroachment trend since early April 2025. Until the rise in early August, the metric had been at its lowest value since June of 2024. The 7-day moving average of hourly encroachment durations is now ten percent above the level of one year ago.
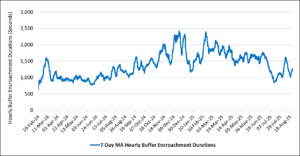
Figure 4. Seven-Day Moving Average of Hourly Buffer Encroachment Durations From February 18, 2024 Through August 23, 2025
