Aviation Safety Monitor Weekly Report for the Week Ending August 31, 2024
Welcome back to the Weekly Aviation Safety Report. Every Monday Robust Analytics reports on safety margins at 26 United States airports. With this Aviation Safety Monitor Weekly Report, Robust Analytics offers the aviation community timely assessments of changing safety margins and safety-related events. Dates and times are tracked in UTC and the week ends at midnight every Saturday. This week’s report includes data through 2400 UTC on August 31, 2024.
For New Readers: Please read our article “Did Safety Degrade in the National Airspace System in the Winter of 2022-2023?” that applies our methods and data to examine whether safety margins decreased during the events of winter 2022-2023.
The Aviation Safety Monitor measures safety margins by estimating the frequency, duration, and severity of buffer encroachments. Our paper “How Do We Measure Safety Margins?” provides a detailed description of the methods and data. That article can be found here https://www.robust-analytics.com/measure on the Robust Analytics website.
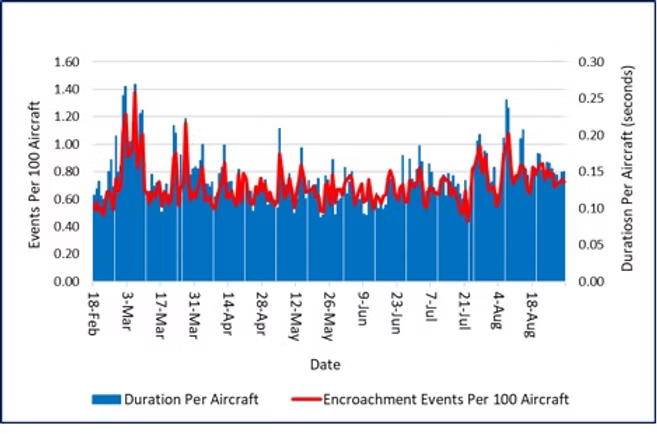
Weekly Safety Margin Update. Safety margins improved slightly over the past week. Figure 1 summarizes the weekly data since the Aviation Safety Monitor began reporting on February 24, 2024. Total encroachments durations for the week decreased 10 percent and the number of encroachment events dropped 12.5 percent. Generally good weather kept the number of Conformance Category PE and C buffer encroachments low throughout the week. The weekly encroachment duration per event increased 0.56 seconds.
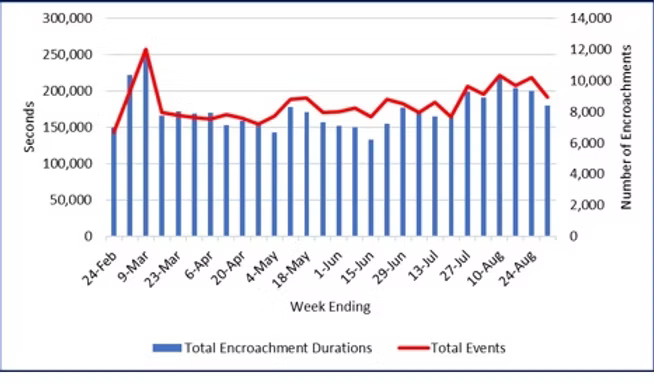
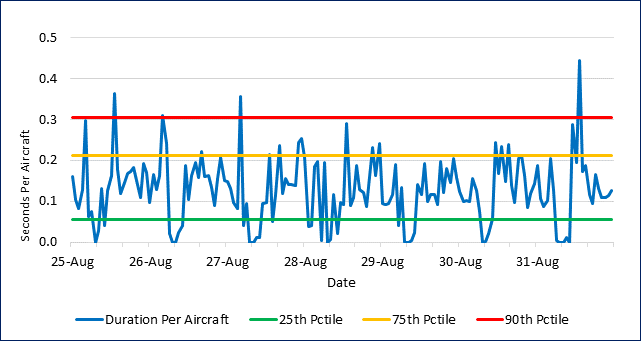
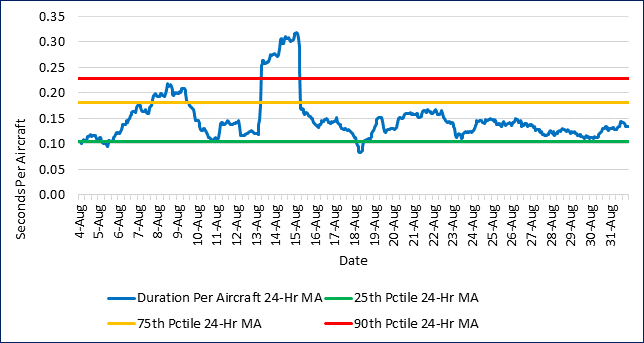
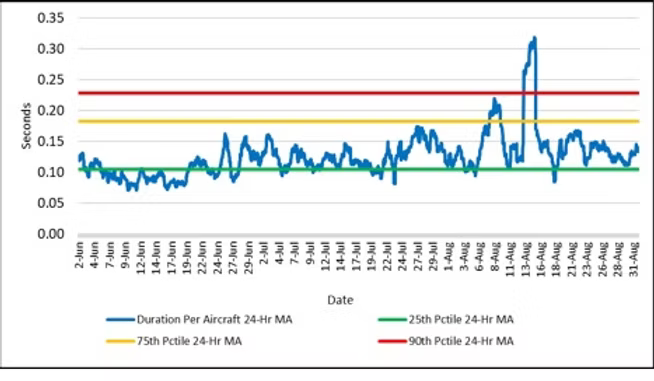
Figure 2 displays the typical time of day pattern that we observe in the data, as encroachment events are highly correlated with traffic density. Even after aggregating the data over 17 metroplexes operating in three time zones the time of day pattern remains prominent. The week ending August 31 was quiet, with only four duration spikes over the 90th percentile. However, there were fourteen hourly reports between the 75th and 90th percentile.
How severe are these encroachments? The FAA defines three separation conformance categories based on how far they are from the separation index. (See the description “How Do We Measure Safety Margins?” for details on the conformance categories and how we measure them.) In that classification system, Conformance Categories A and B are the most severe. Under our definition of a buffer encroachment, Category A and B encroachments are counted under all meteorological conditions.
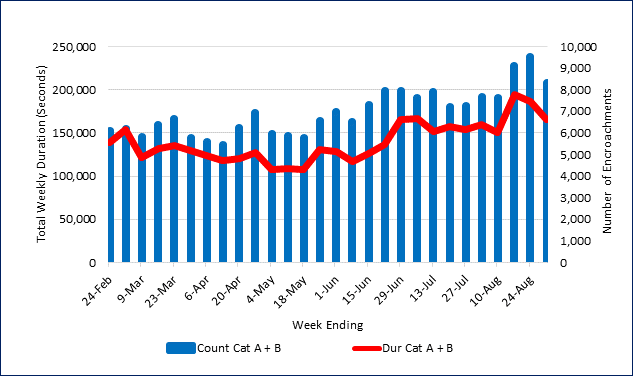
Figure 6 displays information on the most severe separation conformance categories. The weekly durations and event counts for the sum of Category A and B encroachments are shown in Figure 6. The upward drift in these more severe buffer encroachments since the start of May moderated last week, as total encroachment Category A and B durations dropped 10 percent over the previous month. Average daily encroachment durations were 11 percent higher in July than in June. The continued high level of the more severe Category A and B encroachments remains concerning, with the August daily encroachment average 26 percent higher than the June average.
Both the number of buffer encroachments and their durations for Category A and B are at the highest levels since we began reporting in the Aviation Safety Monitor. If readers are interested, we can conduct a deep dive into the conformance category encroachments in a future weekly report. Let us know if that information will be useful.
The Aviation Safety Monitor summarizes output from Risk Tracker, the Robust Analytics in-time terminal airspace hazard and safety metrics monitoring system.
About the Aviation Safety Monitor
The Aviation Safety Monitor is a service provided by Robust Analytics to deliver timely information on terminal area safety in the National Airspace System (NAS). The safety monitoring and prediction technologies were developed by Robust Analytics over the past several years. Partial funding was provided by the NASA Small Business Innovation Research Program and the NASA System Wide Safety Project.
The Aviation Safety Monitor provides quantitative estimates of safety margins at 26 airports in 17 metropolitan regions in the United States. This information complements data on several safety-related events that are published elsewhere, with the FAA’s Runway Incursion Statistics website a good example. However, the available safety information can be misleading if it only reports the frequency of violations with no insight into how safety buffers may vary minute-to-minute and day-to-day. The Aviation Safety Monitor aims to provide this insight every week.
