Aviation Safety Monitor Weekly Report for the Week Ending May 11, 2024
The Aviation Safety Monitor measures safety margins by estimating the frequency, duration, and severity of buffer encroachments. Our paper “How Do We Measure Safety Margins?” provides a detailed description of the methods and data. That can be found here https://www.robust-analytics.com/measure on the Robust Analytics website.
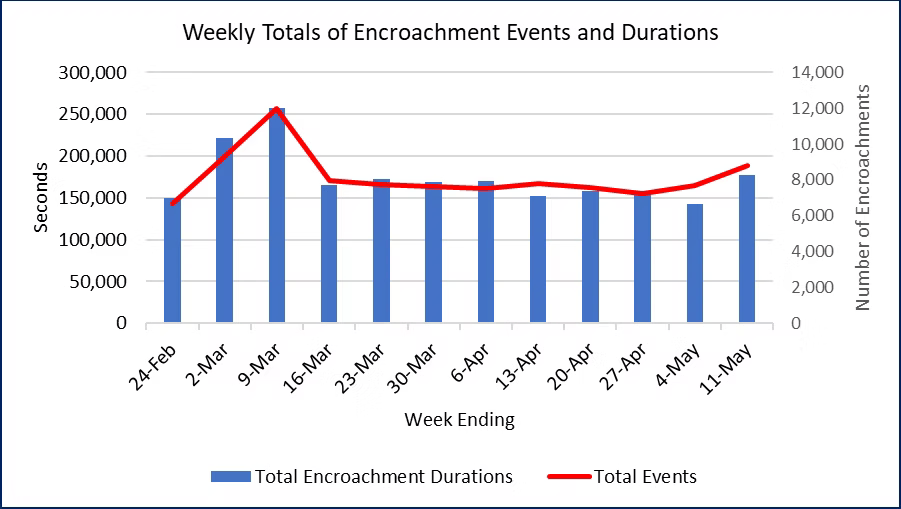
Weekly Safety Margin Update. The steady improvement in safety margins since early March reversed this past week. Total encroachment durations for the 26 airports increased 24.6 percent for the week ending May 11 and are now at the highest level since the week of March 9. Encroachment events also increased by 14 percent over the past week and 22 percent over the past two weeks. These changes can be easily seen in our new Figure 1 that displays weekly summary data for the 26 monitored airports. The Aviation Safety Monitor team will be tracking the daily metrics this week to detect whether this past week was a temporary increase or an indicator of a longer negative trend in safety margins.
Examination of Figure 2 shows that the increase in encroachment durations for this week is due to higher peaks in the hourly data every day from May 5-8. Each of those days had several peak values above the 75th percentile. In contrast, the previous week had only one hour above the 75th percentile during the entire week. Safety margins gradually improved over the last three days of the week. These data reinforce our plan to look for continued improvement in the metrics this week.
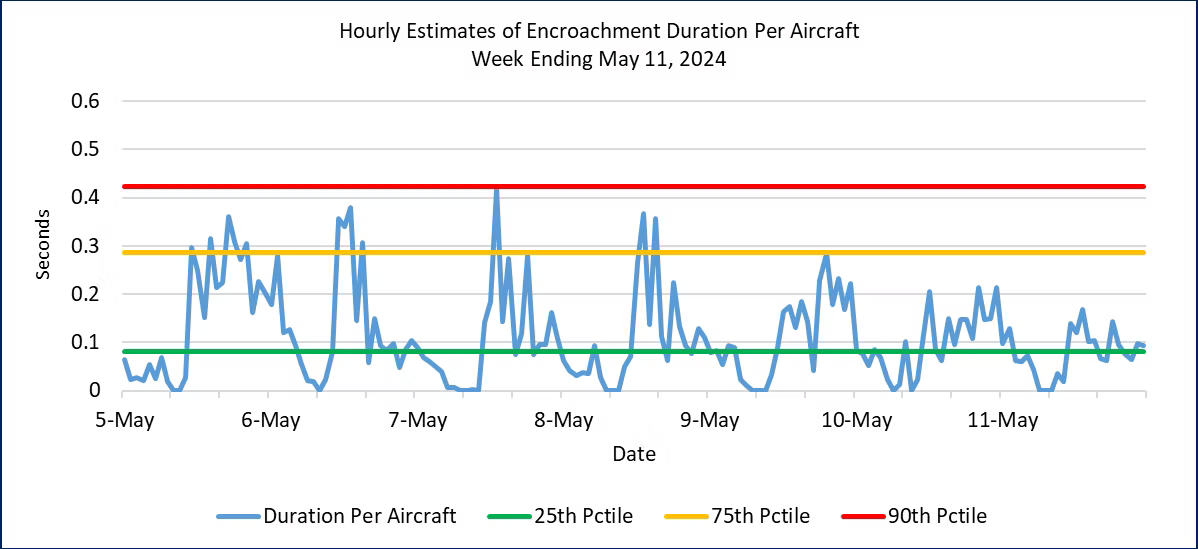
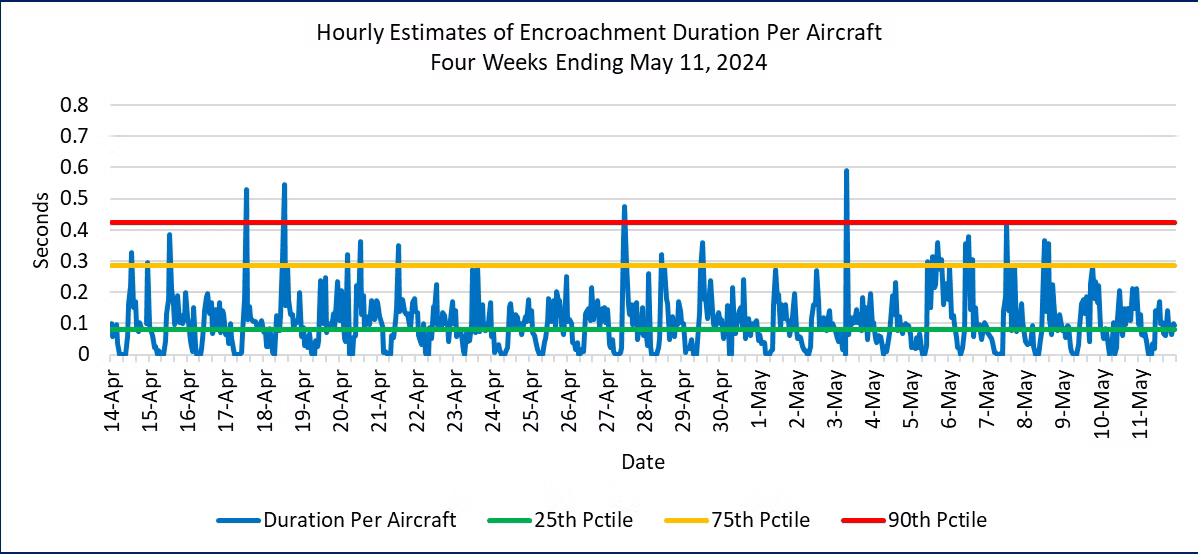
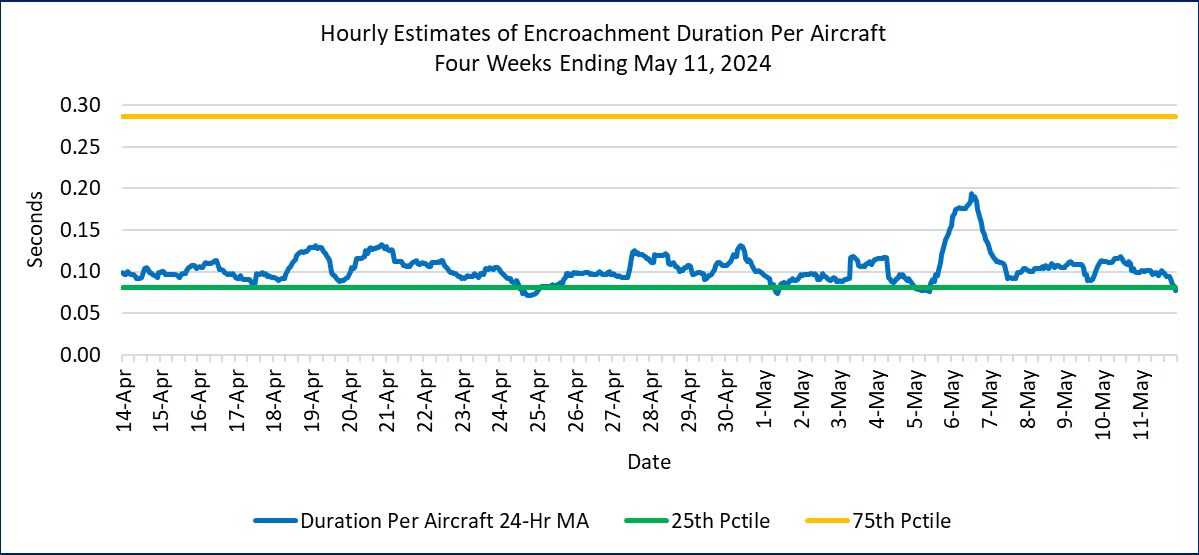
Figure 5. Hourly Encroachment Duration Per Aircraft, February 18 to May 11, 2024
Figure 6 displays the moving average version for the past two months, which highlights the early March increase in encroachment durations for more than a week. This is the only sustained period of more than a couple of days for the past two months.
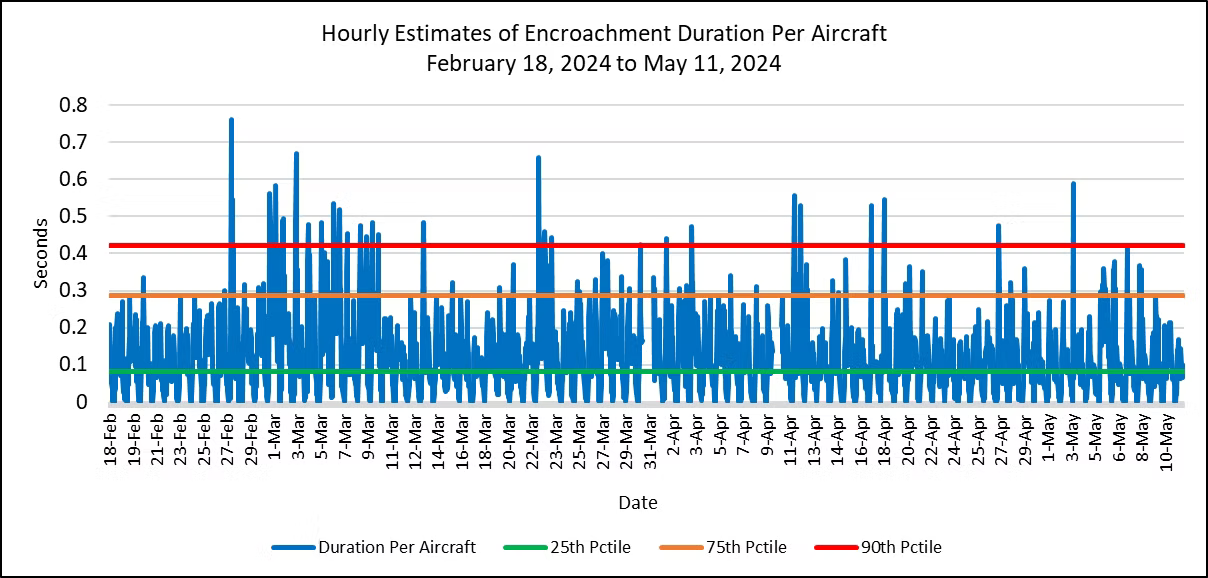

February 18, 2024 through May 11, 2024
How severe are these encroachments? The FAA defines three separation conformance categories based on how far they are from the separation index. (See the description “How Do We Measure Safety Margins?”for details on the conformance categories and how we measure them.) In that classification system, Conformance Categories A and B are the most severe. Under our definition of a buffer encroachment, Category A and B encroachments are counted under all meteorological conditions.
Figure 8 displays information on the most severe separation conformance categories. The daily durations and event counts for the sum of Category A and B encroachments are shown in Figure 7. The pattern differs from the Figure 1, as there is no obvious trend during the time period. This suggests that Category PE and C encroachments are affected by different factors from Category A and B. We will take a deep dive into those differences in a future weekly report.

The Aviation Safety Monitor summarizes output from Risk Tracker, the Robust Analytics in-time terminal airspace hazard and safety metrics monitoring system.
About the Aviation Safety Monitor
The Aviation Safety Monitor is a service provided by Robust Analytics to deliver timely information on terminal area safety in the National Airspace System (NAS). The safety monitoring and prediction technologies were developed by Robust Analytics over the past several years. Partial funding was provided by the NASA Small Business Innovation Research Program and the NASA System Wide Safety Project.
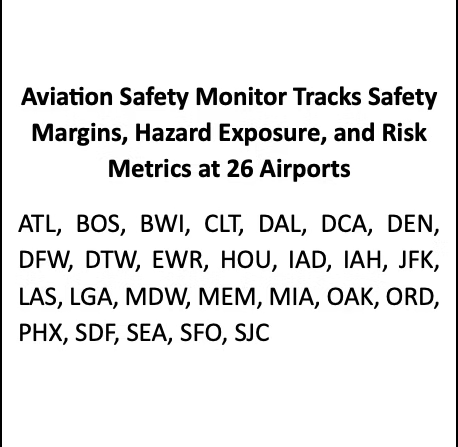
The Aviation Safety Monitor provides quantitative estimates of safety margins at 26 airports in 17 metropolitan regions in the United States. This information complements data on several safety-related events that are published elsewhere, with the FAA’s Runway Incursion Statistics website a good example. However, the available safety information can be misleading if it only reports the frequency of violations with no insight into how safety buffers may vary minute-to-minute and day-to-day. The Aviation Safety Monitor aims to provide this insight every week.
